interacitve dashboard for
Stock data analysis

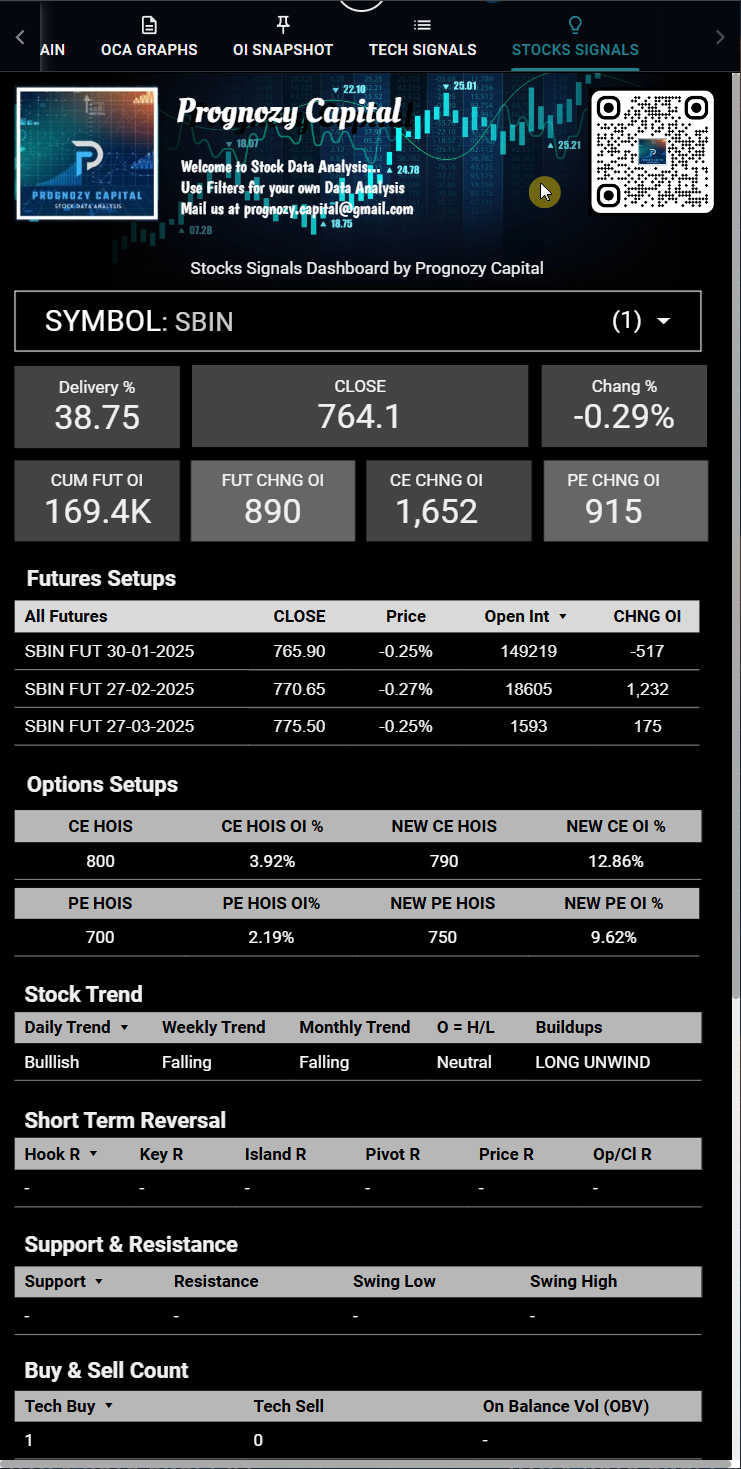
Introducing the SDA Dashboard: Your Ultimate Trading Companion

The SDA Dashboard is your comprehensive solution for in-depth Futures & Options analysis and stock selection. This powerful, mobile-friendly platform empowers you with:

  • Sophisticated Option Chain Filters:
    • Combine OI across multiple expirations or strikes: Gain deeper insights into option chain dynamics.
    • Visualize Data: Analyze option chain data in an intuitive graphical format.
    • 3-Expiry OI Snapshot: Quickly assess option buildup across three expirations for informed decision-making.
  • Advanced Stock Selection Filters:
    • Swing High/Low Breakouts: Filter stocks that have broken key swing levels.
    • Support & Resistance Levels: Identify stocks trading near key support and resistance zones.
    • Technical Indicator Signals: Filter stocks based on buy/sell signals generated by a range of technical indicators.
    • Combine Filters: Create highly customized filters to pinpoint the most promising trading opportunities.
  • Comprehensive Stock-Wise Data:
    • All-in-One View: Access Futures & Options setups, along with all relevant technical buy/sell signals, on a single page for each stock.

Experience the SDA Dashboard Today!

Join the Elite Club for full access to the SDA Dashboard and all other exclusive benefits.

Alternatively, explore the power of the SDA Dashboard with our standalone analysis subscription.

SDA DASHBOARD FEATURES

OI, Price & Volume

Filter FO stocks by our unique filters to get the specific data

Breakout Stocks

Find Breakout stocks by all technical Indicators, like RSI & STR Breakout,

Options Traps

Find Option Writers Trap like CE & PE traps with Near & Next Expiry buildups.

Stock Signals

Get buy sell signals Indicators wise for a specific stock.